What Are Trading Patterns and How Efficient Are They in 2025?
Trading patterns are recurring price formations that signal potential market direction. In 2025, they remain about 60–70% reliable when combined with volume and context, especially in trending markets like Gold or BTC.
After testing over 50 setups on MT5, I found flag patterns perform best in high-volume sessions
By Alex W. | Updated November 2025 | 8-min read
Introduction: Why Patterns Still Matter in 2025
Trading patterns have been around for decades — from the days of Wall Street chalkboards to today’s AI-powered charts.
But are they still reliable in modern markets dominated by bots, high-frequency trades, and unpredictable news events?
Let’s break down what really works, how to use patterns effectively, and what mistakes to avoid if you want to trade smarter — not harder.
What Are Trading Patterns?
In simple terms, trading patterns are visual signals on charts that help traders forecast future price movements.
They’re formed by repeated market behaviors — human psychology, fear, greed, or institutional setups.
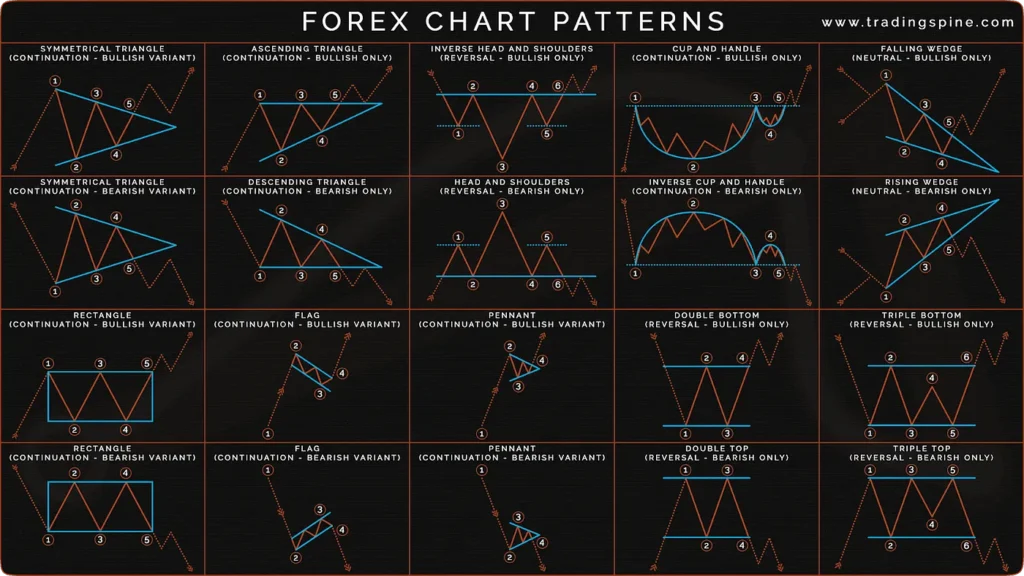
The most common types include:
- Continuation patterns – suggest the current trend will continue (e.g., flags, pennants, wedges).
- Reversal patterns – indicate a possible change in direction (e.g., head and shoulders, double tops, double bottoms).
- Neutral patterns – show indecision or consolidation (e.g., triangles, rectangles).
The Science (and Psychology) Behind Patterns
Markets repeat because humans repeat.
When traders panic or get greedy at the same price zones, similar shapes appear on the chart.
For example:
- A double bottom often shows a rejection of a low price — signaling big buyers stepping in.
- A flag or pennant represents a pause before the next big move, often after a strong breakout.
But beware: patterns don’t cause moves — traders do.
The efficiency of a pattern depends on market volume, timing, and confirmation (breakout, retest, candle close, etc.).
Efficiency in Real Trading
Let’s talk numbers — not myths.
Studies and back-tests show the following average success rates (depending on market and timeframe):
| Pattern | Average Win Rate | Works Best On |
|---|---|---|
| Flag / Pennant | 68–72% | Trending markets |
| Double Top / Bottom | 65% | 4H–Daily charts |
| Head & Shoulders | 60% | High-volume assets |
| Triangle (Symmetrical) | 55% | Breakout trading |
| Rectangle Range | 50–55% | Range scalping |
✅ Tip: Combine pattern recognition with volume spikes, support/resistance zones, and Fibonacci levels to increase accuracy.
Real Example: Gold (XAU/USD) 2025 Setup
Last month, Gold formed a rising wedge around $2,350 – $2,380.
Many retail traders went long expecting $2,400… but smart money saw weakness in volume and shorted the breakdown.
Result? Price dropped to $2,290 before bouncing — classic wedge reversal.
Patterns work when you understand their context, not when you blindly trust the shape.
Efficiency in Different Trading Styles
Each style of trading uses patterns differently:
- Scalpers rely on micro-patterns like flags and wedges on 1-5 minute charts.
- Swing traders use bigger structures (head and shoulders, triangles) for multi-day setups.
- Position traders combine chart patterns with macro trends and fundamentals.
In short: the longer the timeframe, the stronger the pattern.
Pro Tip: Backtest Before You Believe
If you want to know whether a pattern works — test it yourself.
Use TradingView’s replay mode or MT5 historical data and log your pattern trades.
After 30–50 setups, you’ll know your personal win rate.
That’s more powerful than any YouTube strategy.
Bonus: Pattern Trading with a Regulated Broker
If you plan to apply these patterns live, make sure you use a regulated trading platform with low spreads and advanced charting.
👉 Try PU Prime — a globally trusted broker offering fast execution, MT4/MT5 platforms, and 24/7 market access.

Combine technical pattern analysis with their tools like economic calendars and market sentiment indicators to trade smarter.
🧭 Final Thoughts
Trading patterns aren’t magic. They’re visual footprints of market psychology — useful but not infallible.
The real efficiency comes from combining them with risk management, patience, and backtested experience.
So next time you spot a triangle or flag, ask yourself:
“Is this pattern supported by logic — or just by hope?”
Leave a Reply